Plot allocation
Allows the allocation of sampling plots with various types of sampling and plot formats. If you prefer a visual interface, consider using the QGIS module.
Class Parameters
PlotAllocation(shp_dir, epsg)
| Parameters | Description |
|---|---|
| shp_dir | Directory of the shapefile defining the boundary of the area to be sampled. |
| epsg | The EPSG code of the shapefile defining the boundary of the area to be sampled. |
Class Methods
methods and parameters
PlotAllocation.create_plots(distribution, plot_format, plot_area, sample_number,
                            by_hectare, min_border_distance, rectangle_size,
                            x_y_angle, save_buffer, show_plot, save_dir)
| Parameter | Description |
|---|---|
| distribution | Type of distribution or allocation that the plots should be subjected to. |
| plot_format | Format of the plot that will be installed. |
| plot_area | Area of the plot that will be installed. Not used when plot_format = 'rectangle' |
| sample_number | Could be the number of plots, the percentage of the total area that will be sampled or a column in the attribute table containing the number of plots per polygon. If value < 1 it will be understood as a percentage. If value >= 1 it will be understood that you are setting the quantity of plots to allocate. |
| by_hectare | If True, will use sample_number as plots per hectare. If sample_number < 1, it will use the percentage only. |
| min_border_distance | Minimum distance in meters that the plots must be from the edge of the shapefile boundaries. |
| rectangle_size | Used when plot_format = 'rectangle'. Tuple containing the sizes of X and Y of the rectangle (x,y). |
| x_y_angle | Used when distribution = 'systematic custom'. Sets the distance in X and Y of each line in the grid of the systematic distribution and also the rotation angle in degrees (x,y,angle). |
| save_buffer | If true, saves the buffer considering the plot size around the point. |
| show_plot | If true, displays a figure of the allocation performed. |
| save_dir | Directory where the shapefiles will be saved. If None, no shapefile will be saved. |
Available arguments
random: Allocate the plots in a random distributionbest sampling: (recommended) Allocate the plots in the best possible distribution for the area considering the established parameters.systematic: Allocate the plots in a grid distribution, does not allow the definition ofsample_numberand alocate all possible plots.systematic custom: Allocate the plots in a grid distribution with thexandydistances from the grid lines andgrid rotation angledefined by the user.
round: Consider that plots will have a rounded shape.squared: Consider that plots will have a squared shape.rectangle: Allows user to insert the X and Y sizes of the desired rectangle shape.
- In order to achieve the best precision in calculation, you must select the UTM zone that your area is in. Find your utm zone.
Example Usage
Consider the data from 3 fictitious forest stands, located in a forest near the Federal University of Santa Maria, Frederico Westphalen Campus, Brazil.
Download example shapefile.
Attribute table information:
| id | talhao | area_ha | n_par |
|---|---|---|---|
| 1 | A | 4.049 | 3 |
| 2 | B | 15.521 | 5 |
| 3 | C | 39.964 | 14 |
Random distribution
- Import
PlotAllocationclass. - Create the
plotsvariable withPlotAllocationclass. Defines the boundary area shapefile path and the epsg. - Create the plots with
randomdistribuition, using "n_par" column on the atributte table to define the number of plots,plot area = 400 m², a minimum border distance of 2 meters and save the shapefile inC:\Users\Desktop.
show_plot=True, a preview figure showing the plot allocation will be generated.
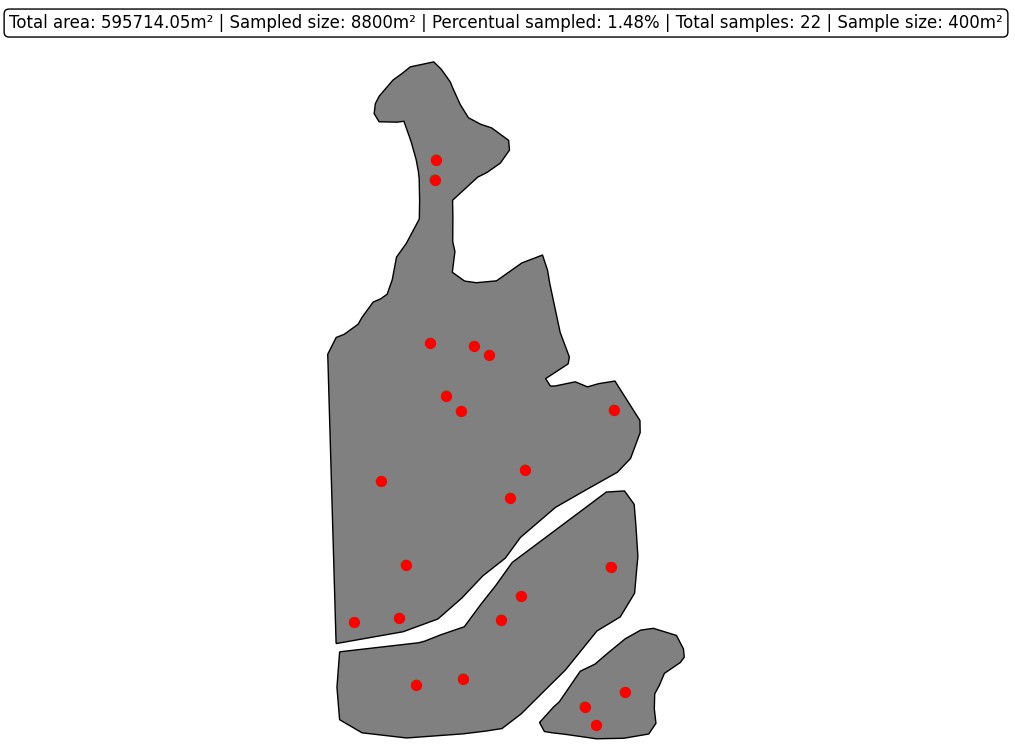
Distribution: Random;
Plot area: 400m²;
Number of plots: column "n_par";
Edge distance: 2 meters;
Plot area: 400m²;
Number of plots: column "n_par";
Edge distance: 2 meters;
Systematic custom distribution
- Import
PlotAllocationclass. - Create the
plotsvariable withPlotAllocationclass. Defines the boundary area shapefile path and the epsg. - Create the plots with
systematic customdistribuition,plot area = 400 m², withx distance = 100 meters,y distance = 50 metersand 45° of grid rotation, with a minimum border distance of 2 meters and save the shapefile inC:\Users\Desktop.
show_plot=True, a preview figure showing the plot allocation will be generated.
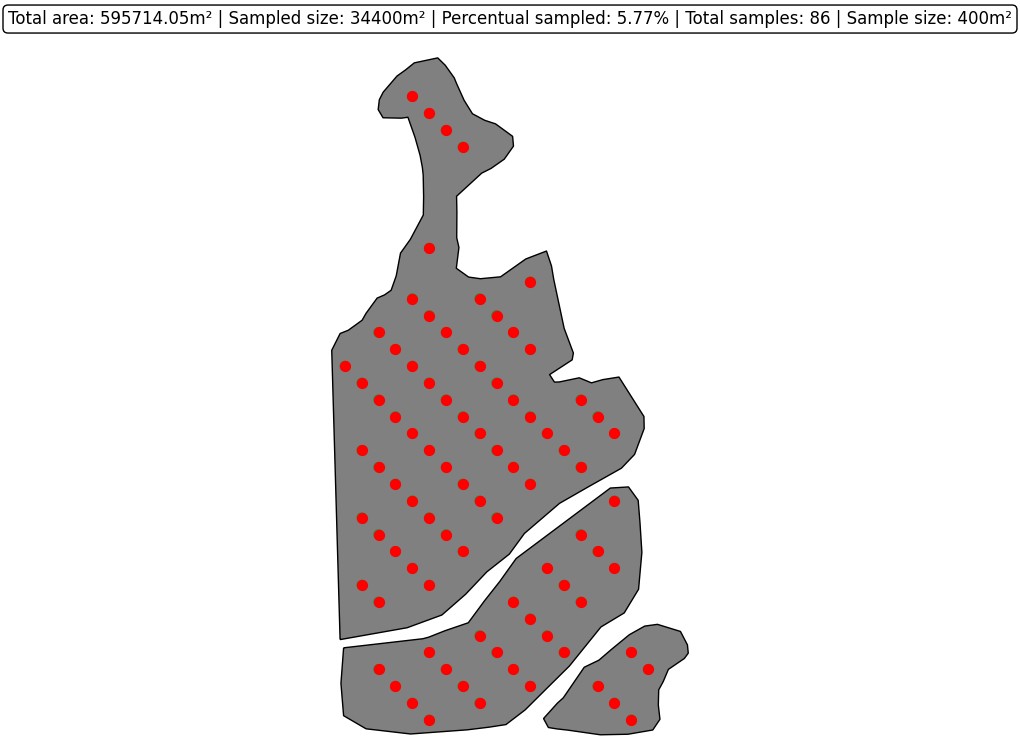
Distribution: Customized systematic;
Plot area: 400m²;
Distance in x: 100;
Distance in y: 50;
Rotation: 45°;
Edge distance: 2 meters;
Plot area: 400m²;
Distance in x: 100;
Distance in y: 50;
Rotation: 45°;
Edge distance: 2 meters;
Rectangle plot format
- Import
PlotAllocationclass. - Create the
plotsvariable withPlotAllocationclass. Defines the boundary area shapefile path and the epsg. - Create the plots with
best samplingdistribuition, arectangle width (x) = 20 metersandheight (y) = 30 meters, a sampling of 2 plots per hectare, with a minimum border distance of 2 meters and save the shapefile inC:\Users\Desktop.
show_plot=True, a preview figure showing the plot allocation will be generated.
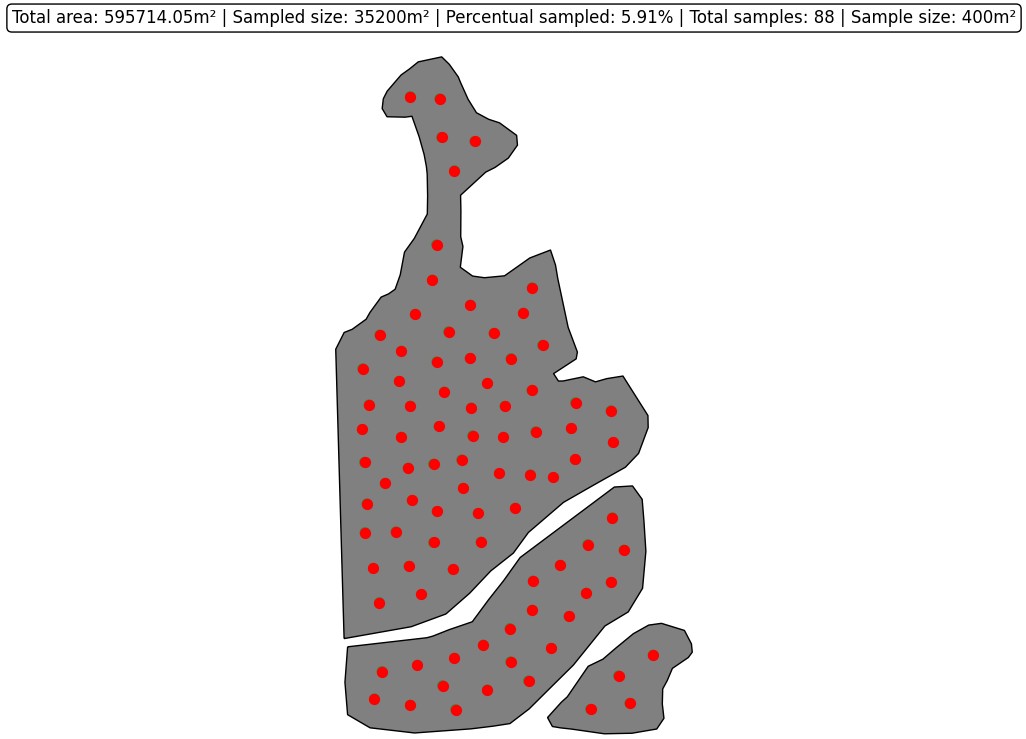
Distribution: Best sampling;
Plot area: 400m²;
Number of plots: 2/hectare;
Edge distance: 2 meters;
Plot area: 400m²;
Number of plots: 2/hectare;
Edge distance: 2 meters;