Stratifier
With this module, you can receive assistance in the stratification process of your forest plantations. Use forest inventory data to automatically stratify the plantations by selecting the forest variables you consider most relevant and either setting a predefined number of strata or allowing the module to determine the optimal number of strata.
Forest Stratification with Python
The forest stratification process requires knowledge of several factors:
- Geographic location
- Tree species
- Soil type
- Stand age
- Product purpose
- Management history
In this context, the Python module developed for stratification emerges as a support tool for forest planning, offering a data-driven initial perspective.
Main Functions
The module includes functions such as:
stratify_kmeansstratify_hierarchical
These functions use multivariate clustering algorithms (k-means and hierarchical, respectively) to identify patterns in continuous variables such as:
- Mean diameter
- Mean height
- Volume per hectare
- Age
- Site index
The algorithms group sample units into homogeneous strata, which can be used for:
- Forest inventory
- Sample allocation
- Management optimization
Important
The results do not replace expert technical interpretation, but provide an objective basis for exploratory analysis, helping to support decision-making in forest projects.
Class Parameters
Stratifier
Stratifier(df, y, *train_columns, iterator=None)
| Parameters | Description |
|---|---|
| df | The dataframe containing the forest inventory data. |
| *groups_columns | Columns that will be used for stratification. Numeric only. |
| iterator | (Optional) The stratification will be performed for each iterator. |
Class Methods
Stratifier.stratify_kmeans(k=None, k_method=None, max_k=100,
                          show_plots=True, save_plots_dir=None)#(1)!

Stratifier.stratify_hierarchical(k=None, k_method=None, max_k=10,
                                show_plots=True, save_plots_dir=None)#(2)!
- k = (Optional) Desired number of strata.
k_method = (Optional) If k is not specified, which method will be used to define the number of k. Options: elbow, silhouette, davies_bouldin, calinski_harabasz.Default = "elbow".
max_k = (Optional) Maximum number of strata to be created.
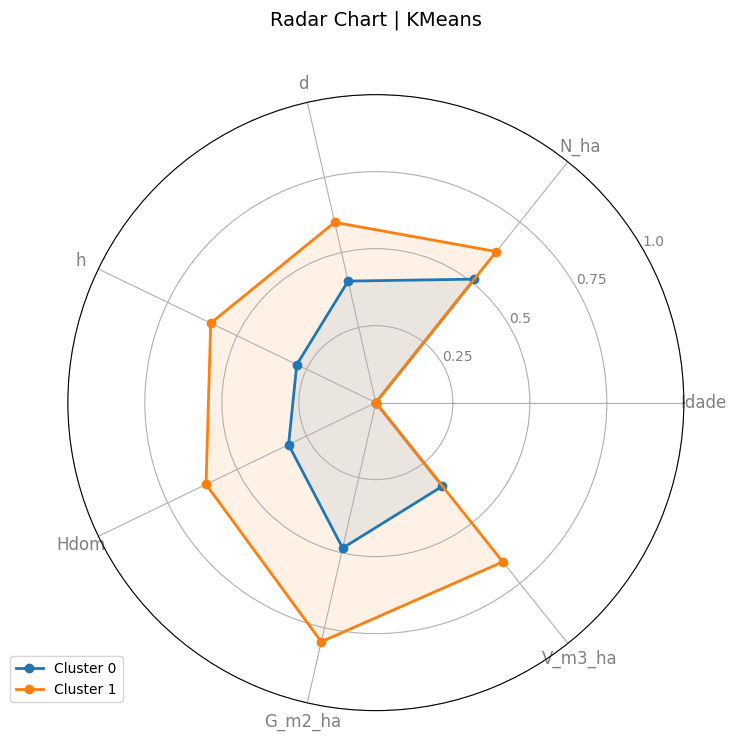
show_plots = Iftrue, displays the radar chart with the generated strata.
save_plot_dir = (Optional) Directory to save the plots of the generated strata. - k = (Optional) Desired number of strata.
k_method = (Optional) If k is not specified, which method will be used to define the number of k. Options: elbow, silhouette, davies_bouldin, calinski_harabasz.Default = "elbow".
max_k = (Optional) Maximum number of strata to be created.
show_plots = Iftrue, displays the radar chart with the generated strata.
save_plot_dir = (Optional) Directory to save the plots of the generated strata.
| Methods | Description |
|---|---|
| .stratify_kmeans() | Performs stratification using the K-Means algorithm. |
| .stratify_hierarchical() | Performs stratification using the Agglomerative Clustering algorithm. |
Important
When the variable k is not defined, the algorithm will attempt to automatically determine the optimal number of strata using the elbow method by default.
To choose a different method for automatic k selection, simply provide the method parameter with the desired method name. The available methods are:
elbow: Based on inertia analysis for differentkvalues. Uses the second derivative to identify the inflection point.silhouette: Uses the silhouette coefficient to evaluate group separation. Higher values indicate better clustering.davies_bouldin: Assesses group compactness and separation. The lower the index, the better the clustering.calinski_harabasz: Uses the ratio between inter-cluster dispersion and intra-cluster dispersion. The higher the index, the better the clustering.
Each method adapts better to different data characteristics. Choosing the appropriate one can significantly improve the quality of the generated strata.
Likewise, users can limit the maximum number of strata through the max_k variable, which sets the highest k value to be considered during the automatic evaluation process.
Example Usage
As an example, we will use an adapted dataset from Arce and Dobner Jr. (2024) for Eucalyptus dunnii. The dataset consists of 81 plots of 300 m², all with an age of 7 years.
- Import the
Stratifierclass. - Import
pandasfor data manipulation.
| stratifier_example.py | |
|---|---|
- Load your
xlsxfile containing the inventory data. - Create a list called
columns_to_checkcontaining the columns to be used for stratification. - Create the variable
stusing thedfdataframe, passing thecolumns_to_checkas stratification parameters. - Perform stratification using the "KMeans" algorithm, allowing the algorithm to determine the number of strata. Save the results in the
stratified_dfvariable. Save the generated radar chart in the specified directory.
Outputs
Tables
stratified_df (1)
- Initial DataFrame with an additional column called
Cluster, which contains the cluster number assigned to each data row, ranging from 0 ton.
| Chave_Parcela | Idade | N_ha | d | h | Hdom | G_m2_ha | V_m3_ha | S | Cluster |
|---|---|---|---|---|---|---|---|---|---|
| 14401109002_P1 | 7 | 866.67 | 16.63 | 16.09 | 16.50 | 19.43 | 112.77 | 15.44 | 0 |
| 14401109003_P2 | 7 | 866.67 | 16.55 | 15.02 | 16.47 | 19.91 | 110.36 | 15.17 | 0 |
| 14401110009_P3 | 7 | 600.00 | 16.96 | 14.07 | 15.32 | 13.92 | 64.83 | 14.71 | 0 |
| 1440817_P3 | 7 | 1066.67 | 16.45 | 14.53 | 16.49 | 24.24 | 129.46 | 14.61 | 0 |
| 1440818_P6 | 7 | 833.33 | 17.27 | 14.62 | 16.00 | 20.79 | 112.73 | 12.64 | 0 |
Charts
References
ARCE, JULIO EDUARDO; DOBNER JR., MARIO. (2024). Management and planning of planted forests: with emphasis on the Pinus and Eucalyptus genera. Curitiba, PR: Ed. dos Autores, 419p.
KARCZMAREK, Pawel; KIERSZTYN, Adam; PEDRYCZ, Witold; AL, Ebru. K-Means-based isolation forest. Knowledge-Based Systems, Amsterdam, v. 195, p. 105659, May 11, 2020. Available at: https://doi.org/10.1016/j.knosys.2020.105659. Accessed on: May 22, 2025.
DETRINIDAD, E.; LÓPEZ-RUIZ, Víctor-Raúl. The Interplay of Happiness and Sustainability: A Multidimensional Scaling and K-Means Cluster Approach. Sustainability, v. 16, n. 22, p. 10068–10068, November 19, 2024.
MÄRZINGER, T.; KOTÍK, J.; PFEIFER, C. Application of Hierarchical Agglomerative Clustering (HAC) for Systemic Classification of Pop-Up Housing (PUH) Environments. Applied Sciences, v. 11, n. 23, p. 11122, November 24, 2021.